Illustrate how to use function mp_edge_relations
Contents
Create Mesher object
When Mesher object is created it takes care of initializing interface to GMSH mesh generator
mesher = mp.Mesher();
Set meshing parameters
mesher.basename ='demolshape';
mesher.folder = '.';
mesher.dim = 2;
mesher.clean = true;
mesher.quadsonly = false;
Create object describing geometric model
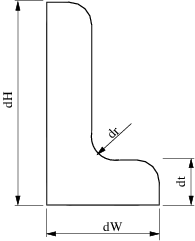
geom = mp.geoms.LShapeGeom('my_domain');
geom.params.dW = 3;
geom.params.dt = 1.2;
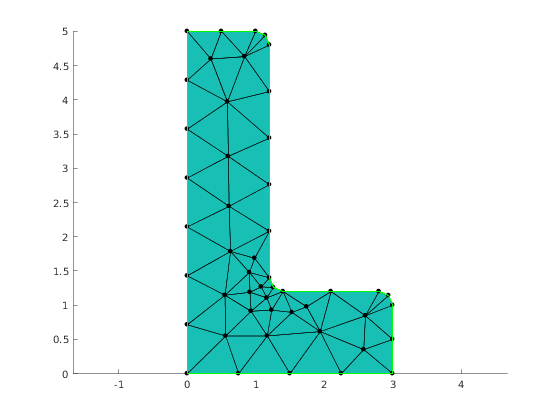
% Generate and visualize mesh again.
mesh = mesher.generate(geom, struct('lc', 0.8));
Show mesh
viewer = mp.Viewer();
viewer.show(mesh);
Edge data in elements
Caclulate edge flags, edge tangent vector and edge normal vector for each element
Create edges selector
The LShapeGeom geometric model distinguishes boundary endges as well as their subsets. Here we prepare selector that will assign tag 0 to boundary edges, and tags 1 and 2 respectively to 'bottom' left' set.
selector.left = 1;
selector.bottom = 3;
selector.other = 4;
selector.boundary = 8;

% The use of Tagger is optional. Tagger object give the ability to precisely
% specify which tags are assigned if mesh elements belongs to multile
% regions. If one is not interested in such fine control it is enough to
% use 'default' string in place of tagger argument.
tagger = mp.Tagger('priority', [0,0; 1, 100; 2,50; 3,25;8,15]);
Get edges data in regions
[elemEdgeTags, elemTan, elemNor, nodeTan, nodeNor] = mp_face_edge_data_at_regions(mesh, 8, selector, tagger);
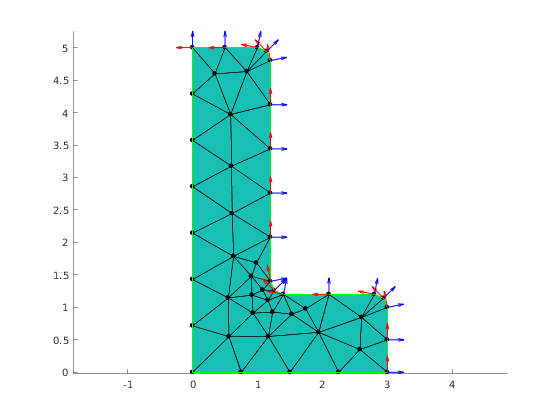
Visualization normal and tangent vectors at nodes of the region edges with tag 2
% Plot arrows for tangent and normal vectors
hold on;
quiver(mesh.nodes(:,1), mesh.nodes(:,2), nodeTan(:,1), nodeTan(:,2), 0.3, 'LineWidth', 1, 'Color', 'red');
quiver(mesh.nodes(:,1), mesh.nodes(:,2), nodeNor(:,1), nodeNor(:,2), 0.3, 'LineWidth', 1, 'Color', 'blue');
mp_manage_demos('report', 'mp_face_edge_data_at_regions', true);