Illustrate how to use function mp_face_edge_data
Contents
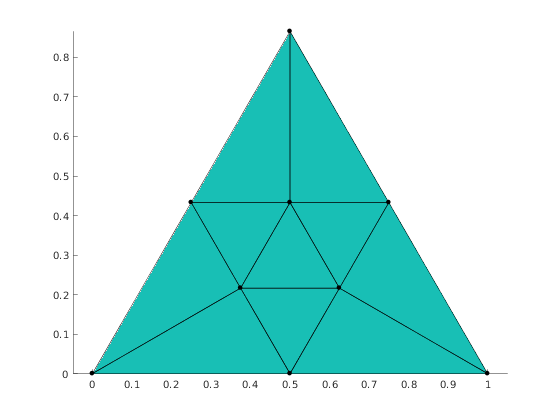
Get one of the predefined meshes.
mesh = mp.MeshFactory.produce('tritri');
Show mesh
viewer = mp.Viewer();
viewer.show(mesh);
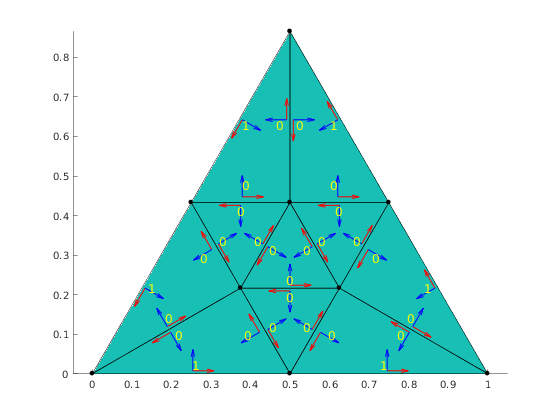
Edge data in elements
Caclulate edge flags, edge tangent vector and edge normal vector for each element
[elemEdgeTags, elemTan, elemNor] = mp_face_edge_data(mesh);
Visualization of edge data
Get face and edge centers
faceCenters = mesh.faceCenters();
edgeCenters = mesh.edgeCenters();
Get face to edge adjacencies
f2e = mesh.getAdjacency(mp.Topo.Face, mp.Topo.Edge);
Count number of labels to print
nlabels = 0;
for i=1:f2e.length
  nlabels = nlabels + length(f2e.at(i));
end
Preallocate arrays of label coordinates and labels
labelCoords = zeros(nlabels, 3);
labels = zeros(nlabels, 1);
Preallocate arrays for tangent vectors, normal vecotrs, and anchor points
tan = zeros(nlabels, 2);
nor = zeros(nlabels, 2);
quiverPoint = zeros(nlabels, 3);

% Fill the the arrays
k = 0;
for i = 1:f2e.length
  edges = f2e.at(i);
  fc = faceCenters(i, :);
  for j = 1:length(edges)
    k = k+1;
    labels(k) = elemEdgeTags(i, j);
    ec = edgeCenters(edges(j), :);
    labelCoords(k, :) = ec + (fc-ec)*0.3;
    quiverPoint(k, :) = ec+(fc-ec)*0.1;
    tan(k, :) = elemTan(i, j, :);
    nor(k, :) = -elemNor(i, j, :);
  end
end
Plot arrows for tangent and normal vectors
hold on;
quiver(quiverPoint(:,1), quiverPoint(:,2), tan(:,1), tan(:,2), 0.3, 'LineWidth', 1, 'Color', 'red');
quiver(quiverPoint(:,1), quiverPoint(:,2), nor(:,1), nor(:,2), 0.3, 'LineWidth', 1, 'Color', 'blue');

Plot labels indicating if elemen edge is boundary edge
mp_plot_labels(gca, labelCoords, struct('labels', labels, 'Color', 'yellow', 'FontSize', 12));
mp_manage_demos('report', 'mp_face_edge_data', true);